
How acoustic emission testing works
A detailed guide to AET sources, wave propagation, sensors, signal analysis, source location and practical limitations.
AET listens while the asset responds
Acoustic emission testing measures short-lived elastic waves released by an active process in a material or structure. Unlike pulse-echo ultrasonic testing, an AE system generally does not transmit a probing wave into the asset. Sensors listen as pressure, mechanical load, temperature change or service conditions stimulate a source.
Examples of possible sources include crack extension, local plastic deformation, fibre or matrix damage in composites, friction, impact and leak flow. These signals are not automatically evidence of a defect: the test must separate relevant activity from flow, valves, supports, handling, weather and electrical interference.
The central question is whether the suspected mechanism will become active during a safe, controlled and measurable condition. A dormant crack may remain acoustically silent.
A sensor and acquisition setup
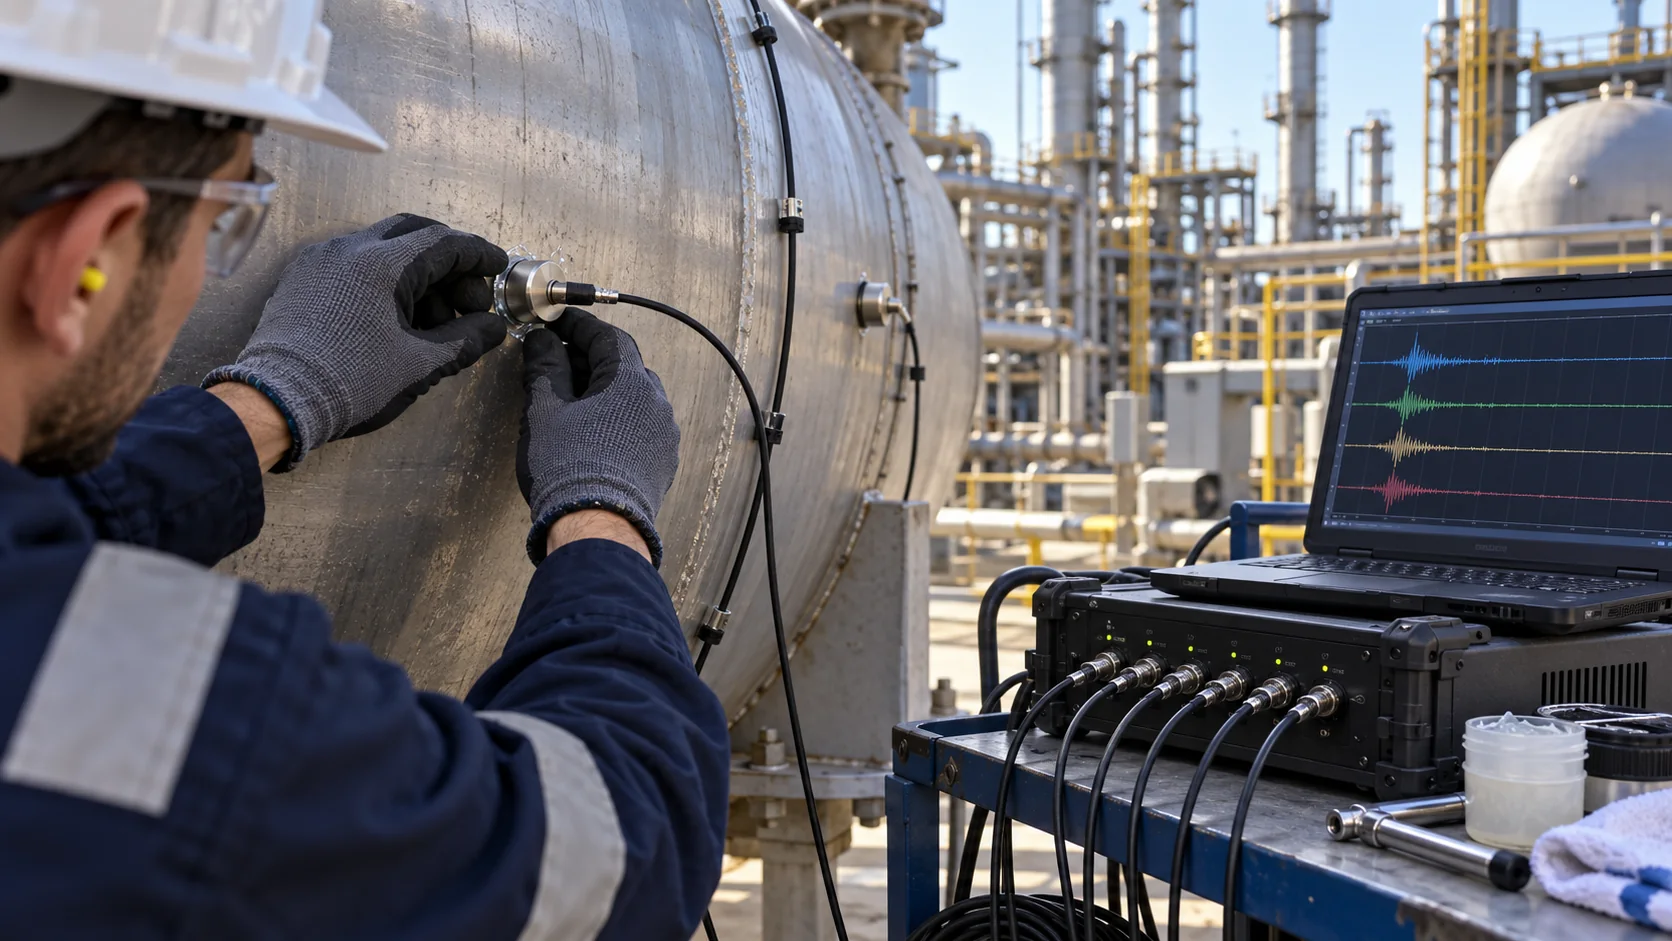
The sensor converts transient surface motion into an electrical signal. Timing across channels, waveform features and the recorded loading sequence support evaluation; a waveform alone does not identify the source mechanism.
The examination sequence
1. Define the objective
Set the asset boundary, suspected mechanism, required decision and applicable code or client specification.
2. Establish an acoustic path
Review material, thickness, geometry, welds, supports, insulation, coatings and attenuation. Select sensor type and spacing through the applicable procedure and verification.
3. Verify the measuring chain
Check sensor coupling, channels, timing, system response and background noise before and during acquisition. A simulated source can test a defined path; it does not calibrate every possible real defect.
4. Apply or observe the stimulus
Record pressure, load, temperature or process variables with time so activity can be related to the condition that produced it.
5. Classify and locate
Review waveforms and features such as amplitude, energy, counts, duration and arrival times. Multiple sensors can support source localization when propagation and timing assumptions are valid.
6. Report and verify
Document zones, coverage, quality checks, activity and limitations, then select local NDT or engineering assessment where needed.
What results can and cannot establish
An AE result can identify monitored activity and sometimes locate a source zone. Trends can show when activity changes relative to load or time. Signal features alone do not universally identify the physical mechanism, measure flaw dimensions or establish remaining life.
Location accuracy depends on sensor geometry, wave speed, propagation path, attenuation and noise. Different materials and complex components can alter waveforms substantially. A report must explain which zones were actually covered and which conditions were not observed.
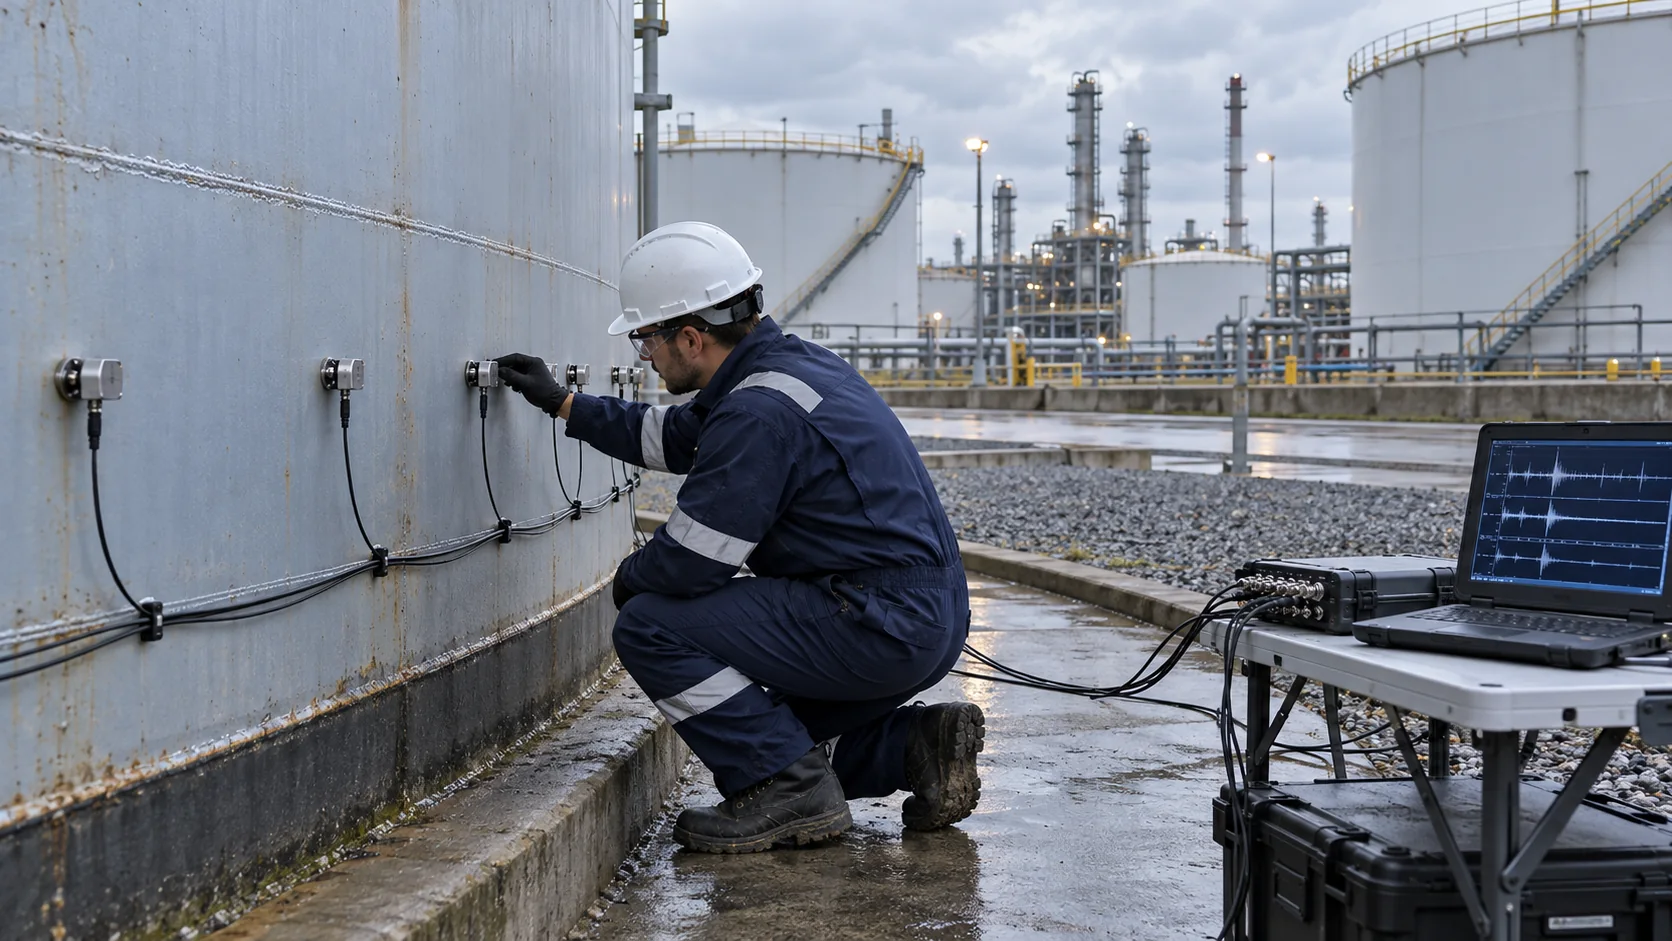
Acoustic emission testing in industrial environments
Sensor placement, test conditions and data acquisition are planned around the specific asset and inspection objective.

Discuss your inspection objective
Send the asset type, location, operating conditions and proposed loading or test window. We can review the information before defining a project-specific scope.